![[경제] RSI(Relative Strength Index) 구경하기](https://img1.daumcdn.net/thumb/R750x0/?scode=mtistory2&fname=https%3A%2F%2Fblog.kakaocdn.net%2Fdna%2FXaD4l%2FbtrTgqsxWzO%2FAAAAAAAAAAAAAAAAAAAAALO3u2sTY3ojPYCaqugfp_-fp8DqhfRzmpkP6MF-sofm%2Fimg.png%3Fcredential%3DyqXZFxpELC7KVnFOS48ylbz2pIh7yKj8%26expires%3D1753973999%26allow_ip%3D%26allow_referer%3D%26signature%3DGRsAqRxrntT3SOAKq5sN65aoZlw%253D)

RSI(Relative Strength Index)
RSI는 가격의 상승 압력과 하락 압력 간의 상대적인 강도를 나타낸다.
일정 기간 동안 주가가 전일 대비 주가의 상승 변화량과 하락 변화량의 평균값을 구해
과매수 구간과 과매도 구간을 판단한다.
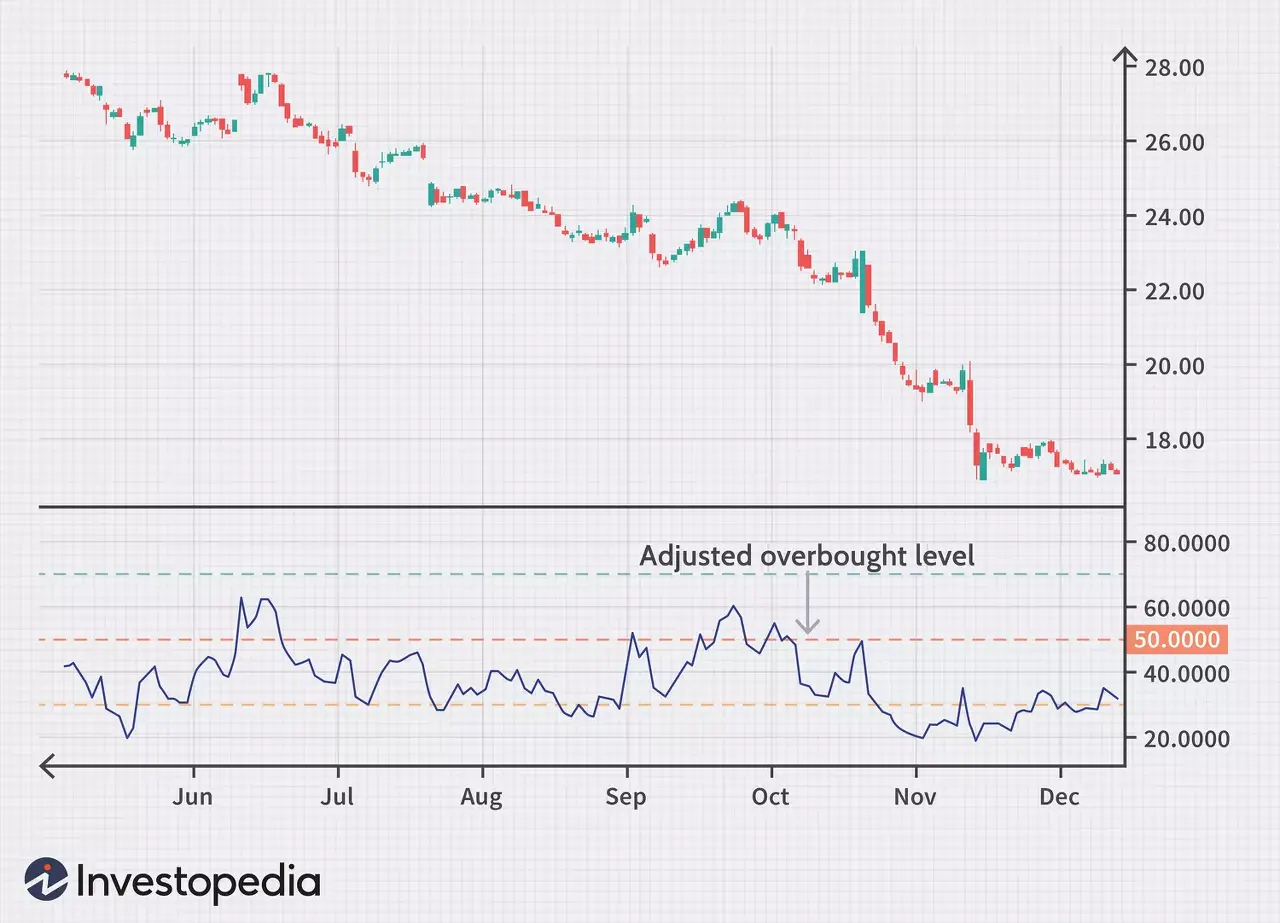
위 차트에서 파란색으로 보이는 그래프가 RSI 지표이다.
일반적으로 RSI가 70% 이상일 때 과매수 구간, 30% 이하일 때 과매도 구간이라고 보면된다!
RSI 30%선을 상향 돌파하면서 주가는 저점을 상승시키면서 꾸준하게 올라가고 이후 RSI 중앙선인 50%선을 돌파함과 동시에 강력하게 주가가 상승하는 모습을 볼 수 있다. 이후 70% 구간에서 조정을 주며 주가가 눌리는 모습이다.
절대적인 지표가 아닌 보조지표인 만큼 Fibonacci Retracement과 같은 다양한 지표를 활용해 판단하고 사용하는 것이 포인트.
Why Is RSI(Relative Strength Index) Important?
- 우리는 RSI를 사용해서 증권의 가격 행동을 예측할 수 있다.
- 과매수 및 과매도 증권을 판별할 수 있다.
- 매수 및 매도 신호를 제공받고 거래전략을 지원한다.
- 트레이더가 추세 or 그 반전을 검증하는데 도움이 될 수 있다.
Using RSI With Trends
트렌드에 맞게 RSI 수준을 수정하는 것도 중요하다.
위에 차트에서도 볼 수 있듯이 하락세 동안 RSI는 70이 아닌 50 근처에서 최고점에 도달한다.
우리는 이것을 하락장 상황을 보다 확실하게 알리는 신호로 볼 수 있고 판단할 수 있다.
트랜드에 맞는 매수 및 매도 신호를 사용하는 것이 중요한 이유는 일반적인 상황이 발생하지 않을 수 있기 때문에 강세 추세에 있을 때는 강세 신호를 사용하고 주식이 약세 즉 하락장 추세에 있을 때 약세 신호를 사용하면 우리가 시장에서 일반적으로 보편화된 RSI가 생성할 수 있는 잘못된 신호를 피하는 데 큰 도움이 될 수 있다. 👉강 강약약
RSI가 이전 저점보다 낮은 저점에 도달하는 동시에 유가 증권의 가격이 이전 저점보다 높은 저점에 도달하면 긍정적인 RSI 반전이 발생할 수 있다. 거래자들은 이 형태를 강세 신호 즉 매수 신호로 간주할 것이다.
반대로 RSI가 이전 고점보다 더 높은 고점에 도달하고 동시에 증권 가격이 더 낮은 고점에 도달하면 마이너스 RSI반전이 발생할 수 있다. Positive와 반대로 이것은 약세 신호이자 매도 신호이다.
어떤 종목에서 RSI를 써먹기가 좋을까
1) 성장이 끝난 큰 기술주들
해당하는 시장을 완전히 장악하고, 현재 기술주의 최대 약점 지적되는 현금부족과 만성 부채를 아예 해결해버린 회사들을 의미한다. MSFT, GOOGL, NVDA, AAPL
2) 단발성 이유에 크게 출렁이는 원자재, 에너지 관련주들
러시아-우크라이나 전쟁 같은 단발성 이슈에 영향을 받는 원자재, 에너지 관련주의 경우 좋은 회사들임에도 불구하고 시장 심리에 따라 등락폭이 큰 경우가 많다. 역시 이 쪽 분야의 좋은 회사들 경우에도 성장이 거의 끝난 기술주들과 마찬가지로 등락폭이 커서 RSI 움직임이 시원하다.
What Is the Relative Strength Index (RSI)?
The relative strength index (RSI) is a momentum indicator used in technical analysis. RSI measures the speed and magnitude of a security's recent price changes to evaluate overvalued or undervalued conditions in the price of that security.
The RSI is displayed as an oscillator (a line graph) on a scale of zero to 100. The indicator was developed by J. Welles Wilder Jr. and introduced in his seminal 1978 book, *New Concepts in Technical Trading Systems.
The RSI can do more than point to overbought and oversold securities. It can also indicate securities that may be primed for a trend reversal or corrective pullback in price. It can signal when to buy and sell. Traditionally, an RSI reading of 70 or above indicates an overbought situation. A reading of 30 or below indicates an oversold condition.
Key Takeaways
- The relative strength index (RSI) is a popular momentum oscillator introduced in 1978.
- The RSI provides technical traders with signals about bullish and bearish price momentum, and it is often plotted beneath the graph of an asset’s price.
- An asset is usually considered overbought when the RSI is above 70 and oversold when it is below 30.
- The RSI line crossing below the overbought line or above oversold line is often seen by traders as a signal to buy or sell.
- The RSI works best in trading ranges rather than trending markets.
How the Relative Strength Index (RSI) Works
As a momentum indicator, the relative strength index compares a security's strength on days when prices go up to its strength on days when prices go down. Relating the result of this comparison to price action can give traders an idea of how a security may perform. The RSI, used in conjunction with other technical indicators, can help traders make better-informed trading decisions.
Calculating RSI
The RSI uses a two-part calculation that starts with the following formula:

The average gain or loss used in this calculation is the average percentage gain or loss during a look-back period. The formula uses a positive value for the average loss. Periods with price losses are counted as zero in the calculations of average gain. Periods with price increases are counted as zero in the calculations of average loss.
The standard number of periods used to calculate the initial RSI value is 14. For example, imagine the market closed higher seven out of the past 14 days with an average gain of 1%. The remaining seven days all closed lower with an average loss of −0.8%.
The first calculation for the RSI would look like the following expanded calculation:

Once there are 14 periods of data available, the second calculation can be done. Its purpose is to smooth the results so that the RSI only nears 100 or zero in a strongly trending market.

Plotting RSI
After the RSI is calculated, the RSI indicator can be plotted beneath an asset’s price chart, as shown below. The RSI will rise as the number and size of up days increase. It will fall as the number and size of down days increase.

As you can see in the above chart, the RSI indicator can stay in the overbought region for extended periods while the stock is in an uptrend. The indicator may also remain in oversold territory for a long time when the stock is in a downtrend. This can be confusing for new analysts, but learning to use the indicator within the context of the prevailing trend will clarify these issues.
Why Is RSI Important?
- Traders can use RSI to predict the price behavior of a security.
- It can help traders validate trends and trend reversals.
- It can point to overbought and oversold securities.
- It can provide short-term traders with buy and sell signals.
- It's a technical indicator that can be used with others to support trading strategies.
Using RSI With Trends
Modify RSI Levels to Fit Trends
The primary trend of the security is important to know to properly understand RSI readings. For example, well-known market technician Constance Brown, CMT, proposed that an oversold reading by the RSI in an uptrend is probably much higher than 30. Likewise, an overbought reading during a downtrend is much lower than 70.
As you can see in the following chart, during a downtrend, the RSI peaks near 50 rather than 70. This could be seen by traders as more reliably signaling bearish conditions.
Many investors create a horizontal trendline between the levels of 30 and 70 when a strong trend is in place to better identify the overall trend and extremes.
On the other hand, modifying overbought or oversold RSI levels when the price of a stock or asset is in a long-term horizontal channel or trading range (rather than a strong upward or downward trend) is usually unnecessary.
The relative strength indicator is not as reliable in trending markets as it is in trading ranges. In fact, most traders understand that the signals given by the RSI in strong upward or downward trends often can be false.
Use Buy and Sell Signals That Fit Trends
A related concept focuses on trade signals and techniques that conform to the trend. In other words, using bullish signals primarily when the price is in a bullish trend and bearish signals primarily when a stock is in a bearish trend may help traders to avoid the false alarms that the RSI can generate in trending markets.
Overbought or Oversold
Generally, when the RSI indicator crosses 30 on the RSI chart, it is a bullish sign and when it crosses 70, it is a bearish sign. Put another way, one can interpret that RSI values of 70 or above indicate that a security is becoming overbought or overvalued. It may be primed for a trend reversal or corrective price pullback. An RSI reading of 30 or below indicates an oversold or undervalued condition.
Overbought refers to a security that trades at a price level above its true (or intrinsic) value. That means that it's priced above where it should be, according to practitioners of either technical analysis or fundamental analysis. Traders who see indications that a security is overbought may expect a price correction or trend reversal. Therefore, they may sell the security.
The same idea applies to a security that technical indicators such as the relative strength index highlight as oversold. It can be seen as trading at a lower price than it should. Traders watching for just such an indication might expect a price correction or trend reversal and buy the security.
Interpretation of RSI and RSI Ranges
During trends, the RSI readings may fall into a band or range. During an uptrend, the RSI tends to stay above 30 and should frequently hit 70. During a downtrend, it is rare to see the RSI exceed 70. In fact, the indicator frequently hits 30 or below.
These guidelines can help traders determine trend strength and spot potential reversals. For example, if the RSI can’t reach 70 on a number of consecutive price swings during an uptrend, but then drops below 30, the trend has weakened and could be reversing lower.
The opposite is true for a downtrend. If the downtrend is unable to reach 30 or below and then rallies above 70, that downtrend has weakened and could be reversing to the upside. Trend lines and moving averages are helpful technical tools to include when using the RSI in this way.
TIP: Be sure not to confuse RSI and relative strength. The first refers to changes in the the price momentum of one security. The second compares the price performance of two or more securities.
Example of RSI Divergences
An RSI divergence occurs when price moves in the opposite direction of the RSI. In other words, a chart might display a change in momentum before a corresponding change in price.
A bullish divergence occurs when the RSI displays an oversold reading followed by a higher low that appears with lower lows in the price. This may indicate rising bullish momentum, and a break above oversold territory could be used to trigger a new long position.
A bearish divergence occurs when the RSI creates an overbought reading followed by a lower high that appears with higher highs on the price.
As you can see in the following chart, a bullish divergence was identified when the RSI formed higher lows as the price formed lower lows. This was a valid signal, but divergences can be rare when a stock is in a stable long-term trend. Using flexible oversold or overbought readings will help identify more potential signals.

Example of Positive-Negative RSI Reversals
An additional price-RSI relationship that traders look for is positive and negative RSI reversals. A positive RSI reversal may take place once the RSI reaches a low that is lower than its previous low at the same time that a security's price reaches a low that is higher than its previous low price. Traders would consider this formation a bullish sign and a buy signal.
Conversely, a negative RSI reversal may take place once the RSI reaches a high that is higher that its previous high at the same time that a security's price reaches a lower high. This formation would be a bearish sign and a sell signal.
Example of RSI Swing Rejections
Another trading technique examines RSI behavior when it is reemerging from overbought or oversold territory. This signal is called a bullish swing rejection and has four parts:
- The RSI falls into oversold territory.
- The RSI crosses back above 30.
- The RSI forms another dip without crossing back into oversold territory.
- The RSI then breaks its most recent high.
As you can see in the following chart, the RSI indicator was oversold, broke up through 30, and formed the rejection low that triggered the signal when it bounced higher. Using the RSI in this way is very similar to drawing trend lines on a price chart.

There is a bearish version of the swing rejection signal that is a mirror image of the bullish version. A bearish swing rejection also has four parts:
- The RSI rises into overbought territory.
- The RSI crosses back below 70.
- The RSI forms another high without crossing back into overbought territory.
- The RSI then breaks its most recent low.
The following chart illustrates the bearish swing rejection signal. As with most trading techniques, this signal will be most reliable when it conforms to the prevailing long-term trend. Bearish signals during downward trends are less likely to generate false alarms.

The Difference Between RSI and MACD
The moving average convergence divergence (MACD) is another trend-following momentum indicator that shows the relationship between two moving averages of a security’s price. The MACD is calculated by subtracting the 26-period exponential moving average (EMA) from the 12-period EMA. The result of that calculation is the MACD line.
A nine-day EMA of the MACD, called the signal line, is then plotted on top of the MACD line. It can function as a trigger for buy and sell signals. Traders may buy the security when the MACD crosses above its signal line and sell, or short, the security when the MACD crosses below the signal line.
The RSI was designed to indicate whether a security is overbought or oversold in relation to recent price levels. It's calculated using average price gains and losses over a given period of time. The default time period is 14 periods, with values bounded from 0 to 100.
The MACD measures the relationship between two EMAs, while the RSI measures price change momentum in relation to recent price highs and lows. These two indicators are often used together to provide analysts with a more complete technical picture of a market.
These indicators both measure the momentum of an asset. However, they measure different factors, so they sometimes give contradictory indications. For example, the RSI may show a reading above 70 for a sustained period of time, indicating a security is overextended on the buy side.
At the same time, the MACD could indicate that buying momentum is still increasing for the security. Either indicator may signal an upcoming trend change by showing divergence from price (the price continues higher while the indicator turns lower, or vice versa).
Limitations of the RSI
The RSI compares bullish and bearish price momentum and displays the results in an oscillator placed beneath a price chart. Like most technical indicators, its signals are most reliable when they conform to the long-term trend.
True reversal signals are rare and can be difficult to separate from false alarms. A false positive, for example, would be a bullish crossover followed by a sudden decline in a stock. A false negative would be a situation where there is a bearish crossover, yet the stock suddenly accelerated upward.
Since the indicator displays momentum, it can stay overbought or oversold for a long time when an asset has significant momentum in either direction. Therefore, the RSI is most useful in an oscillating market (a trading range) where the asset price is alternating between bullish and bearish movements.
What Does RSI Mean?
The relative strength index (RSI) measures the price momentum of a stock or other security. The basic idea behind the RSI is to measure how quickly traders are bidding the price of the security up or down. The RSI plots this result on a scale of 0 to 100.
Readings below 30 generally indicate that the stock is oversold, while readings above 70 indicate that it is overbought. Traders will often place this RSI chart below the price chart for the security, so they can compare its recent momentum against its market price.
Should I Buy When RSI Is Low?
Some traders consider it a buy signal if a security’s RSI reading moves below 30. This is based on the idea that the security has been oversold and is therefore poised for a rebound. However, the reliability of this signal will depend in part on the overall context. If the security is caught in a significant downtrend, then it might continue trading at an oversold level for quite some time. Traders in that situation might delay buying until they see other technical indicators confirm their buy signal.
As the relative strength index is mainly used to determine whether a security is overbought or oversold, a high RSI reading can mean that a security is overbought and the price may drop. Therefore, it can be a signal to sell the security.
What Is the Difference Between RSI and Moving Average Convergence Divergence (MACD)?
RSI and moving average convergence divergence (MACD) are both momentum measurements that can help traders understand a security’s recent trading activity. However, they accomplish this goal in different ways.
In essence, the MACD works by smoothing out the security’s recent price movements and comparing that medium-term trend line to a short-term trend line showing its more recent price changes. Traders can then base their buy and sell decisions on whether the short-term trend line rises above or below the medium-term trend line.
[경제] Fibonacci Retracement 피보나치 되돌림
Fibonacci Retracement 피보나치 되돌림 피보나치 되물림이라고 불리는 이것은 투자 자산 가격 데이터를 분석하는 기술적 데이터 분석 방법 중 하나이다. 피보나치 수열이라고 수학 시간에 많이 들어
goodmorning-sun.tistory.com
Relative Strength Index (RSI) Indicator Explained With Formula
The Relative Strength Index (RSI) is a momentum indicator that measures the magnitude of recent price changes to analyze overbought or oversold conditions.
www.investopedia.com
'📈오늘의 경제' 카테고리의 다른 글
| [경제] 인플레이션 감축법(IRA), 현대차 오열 (0) | 2022.12.28 |
|---|---|
| [경제] Call & Put Option (콜옵션, 풀옵션) 파헤치기 (2) | 2022.12.17 |
| [경제] Fibonacci Retracement 피보나치 되돌림 (0) | 2022.12.10 |
| [경제] PTP(Publicly Traded Partnership) 파헤치기 (0) | 2022.12.06 |
| [경제] PTP 적용 종목, 정리 대작전 (1) | 2022.12.06 |